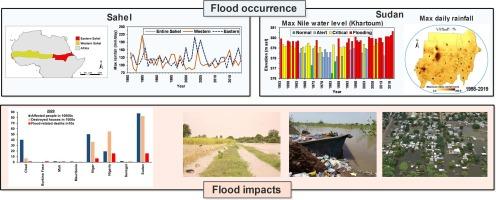
Flood events occur frequently in many regions of SSA due to high climate variability and associated extreme precipitation events1. Growing population along with continued socio-economic changes such as urbanisation and farming expansion increase exposure to flooding2,3,4,5 and result in large increases in flood risk6,7,8. Flooding poses long-term challenges to livelihoods in SSA, not only through loss of lives, destruction of farmlands and infrastructure6, but also disease outbreaks and worsened food and water security1.
The damaging impacts on livelihoods can be reduced by proper flooding mitigation strategies that are guided by sufficient flood hazard assessment, monitoring, and early warning. However, lack of monitoring and information on flood extent and flood exposure hampers spatial targeting of effective mitigation strategies. Flood exposure, defined as population and assets located in flood-prone areas9, however has received little attention to date (Smith et al. 201910). The few flood exposure assessment studies either mainly assess broad land cover classes such as 'urban area'11 or only use population map layers10, whilst very few focus on infrastructures such as roads and water supplies. A comprehensive flood exposure assessment is fundamental for flood risk assessment and key for developing flooding mitigation strategies, but also particularly crucial in data-scarce SSA, the only global region showing increasing flood mortality rates since 199012. Accurate flood mapping and flood exposure assessment can help address this increase in mortality rates13.

The availability of accurate historical and current information on flood hazard events is particularly limited in SSA14. Flood hazard models have been implemented for flood forecasting and monitoring15,16. However, the accuracy of model-based flood hazard maps is restricted as it depends on the accuracy of various input data such as meteorological and topography data, thereby leading to greater uncertainty from error propagation11. In addition, these flood hazard models tend to focus on the national or regional scale that is not designed for local-scale estimation where the impacts are experienced and local-level decisions are required11. Global-scale flood datasets derived from satellite data are available, such as the MODIS NRT Global Flood Product17, the MODIS Global Flood Database18, and the Global Flood Detection System19. These datasets again have coarse spatial resolution and validation of them is highly challenging, particularly in data-sparse regions such as SSA14 where accurate data on flood extent at the local scale is greatly needed for risk management20,21.
Progress has been made to monitor flood inundation at the local scale and over the long term, particularly with the development of Earth Observation (EO) systems with increased revisit frequency and higher spatial resolution that are increasingly used in operational disaster monitoring systems22. Synthetic Aperture Radar (SAR) is particularly useful for flood mapping since it can provide frequent observations23,24 thanks to its capability to monitor land in almost any weather conditions25,26. Flooded areas generate a low backscatter signal and appear to be dark in SAR images, which makes them distinguishable from other land cover classes such as agricultural land or built-up areas. Many studies have used SAR images to map flood inundation27, using algorithms such as histogram thresholding or clustering28, change detection29,30, and time series analysis26. To successfully map inundation areas using such algorithms, defining a robust and objective threshold is critical as results can be sensitive to the thresholds used31. Currently, most studies are either based on a universal threshold value that may be unsuitable for specific sub-regions, or dependent on user-defined empirical analysis, which makes it difficult to apply in different study regions. Our study, however, proposes an approach that defines a threshold in an objective way, that is, use optical satellite images to define thresholds for SAR-based flood mapping techniques (Sect. 3.1.1). Optical images can detect water bodies32,33,34, but tend to underestimate flooded areas as they are subject to cloud cover during the rainy and flood season20. Spatial overlap of water bodies detected from optical images with SAR images can demonstrate the range of backscatter signal in SAR images, and can therefore be used to define thresholds objectively that are tailored for local scale application (Sect. 3.1.1). Alongside using a combination of optical images and SAR images to improve existing algorithms for flood mapping using SAR data, our study also derived flood extent and calculated total inundation area from both optical and SAR images, which provide benefits of long-term coverage of optical imagery while addressing cloud cover issues via the use of SAR.
In addition, the lack of local ground data that can be used to evaluate the accuracy and limitations of satellite data-derived flood extent has been another major drawback in previous studies. Most studies assess accuracy via inter-comparison of satellite-based flooding maps20,22, for example, by using optical images to evaluate the accuracy of flood mapping from radar images20. However, this approach carries limitations as optical imagery may be affected by high cloud occurrence. Alongside using high-resolution satellite data for assessing accuracy, this study also collected ground data through participatory mapping to assess the accuracy of satellite-based flood maps. Participatory mapping, which engages local knowledge and expertise and allows local communities to delineate flood-affected extent on provided basemaps, has been widely recognized as an effective tool to collect and understand flood extent on the ground35. Involving communities’ knowledge of floods through participatory mapping is critical in the data-scarce SSA context as communities experience flooding first hand. Despite the value of local experience and knowledge, very few attempts have been made to combine flood extent derived from satellite data and through participatory mapping1,36,37 for evaluating satellite-derived flood extent accuracy. Such a comparison can not only enable accuracy assessment of satellite-derived flood extent, but also indicate flood-prone areas associated with high impacts for local communities.
This research, for the first time, employed a combination of top-down approaches based on multi-source satellite images and a consultative approach via participatory mapping to map flooded areas and their dynamics. Further, it investigates the scale and severity of population, infrastructure and farmland exposure to flooding in the White Volta basin in Ghana. Specifically, this study aims to:
